See It in Action
A modern, intuitive interface for professional Modbus testing and simulation.
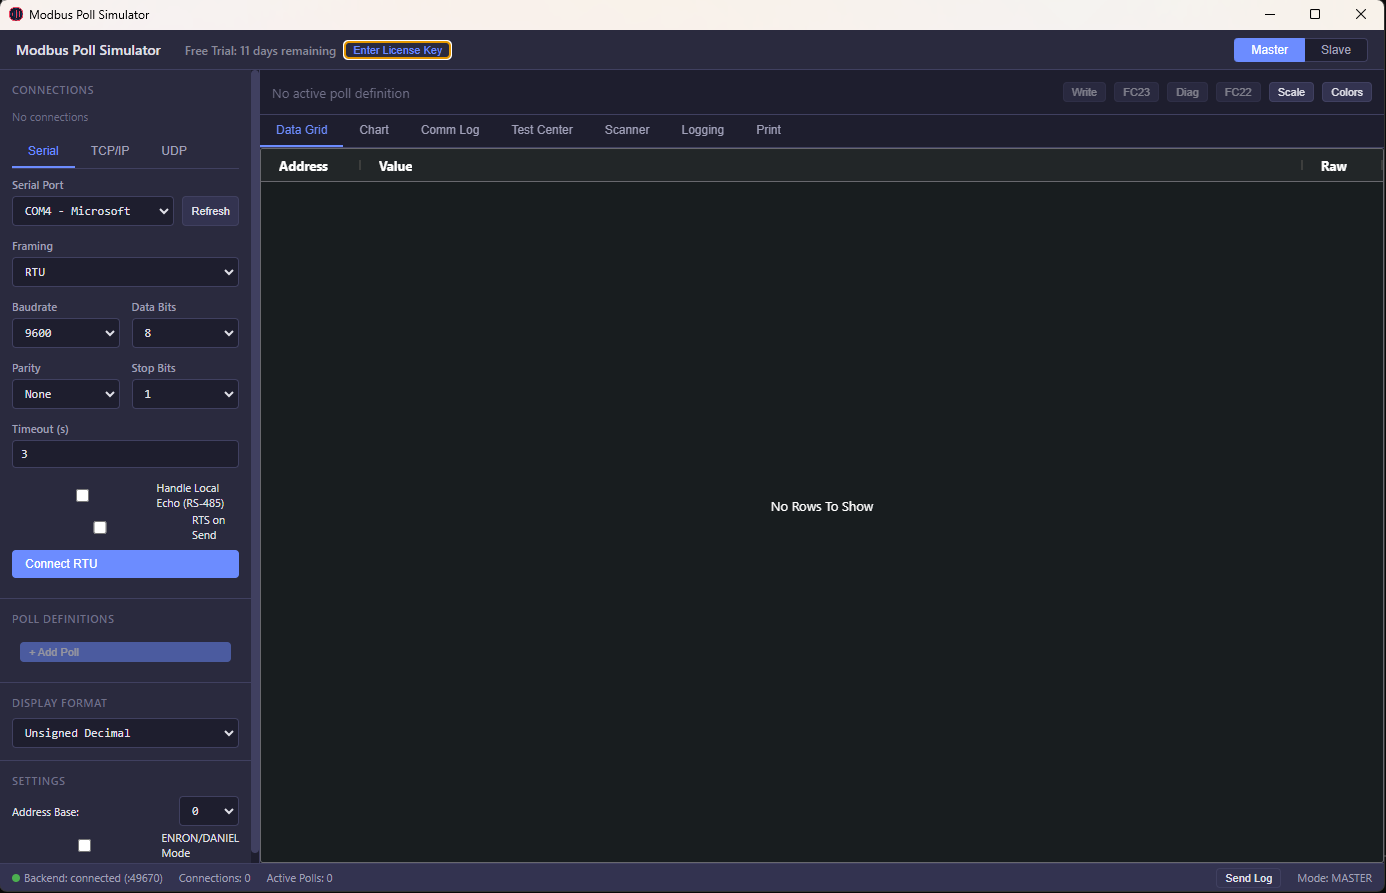
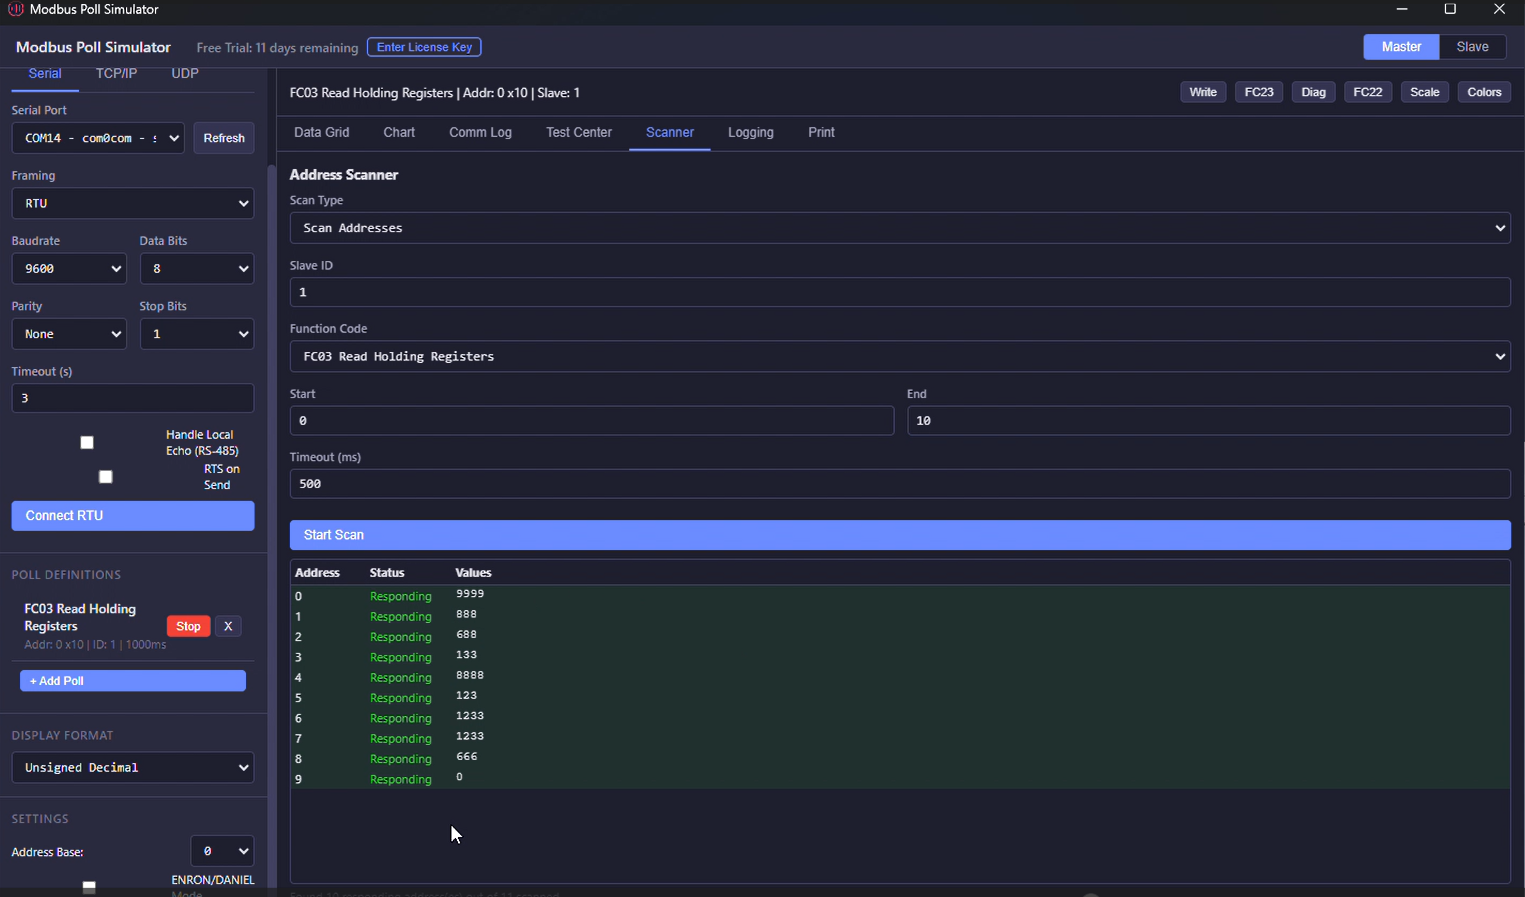 Address Scanner
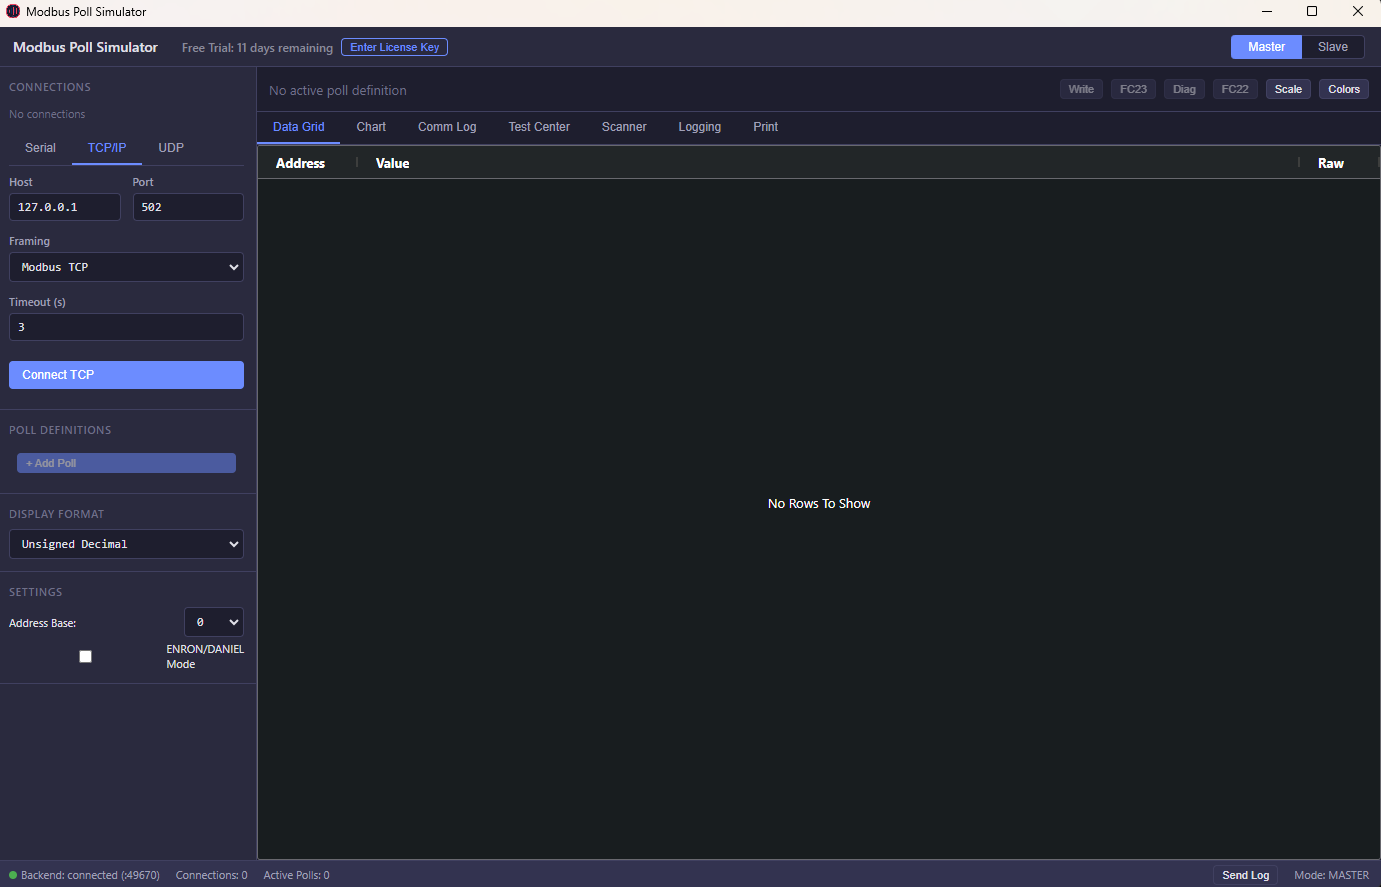 Live Charts
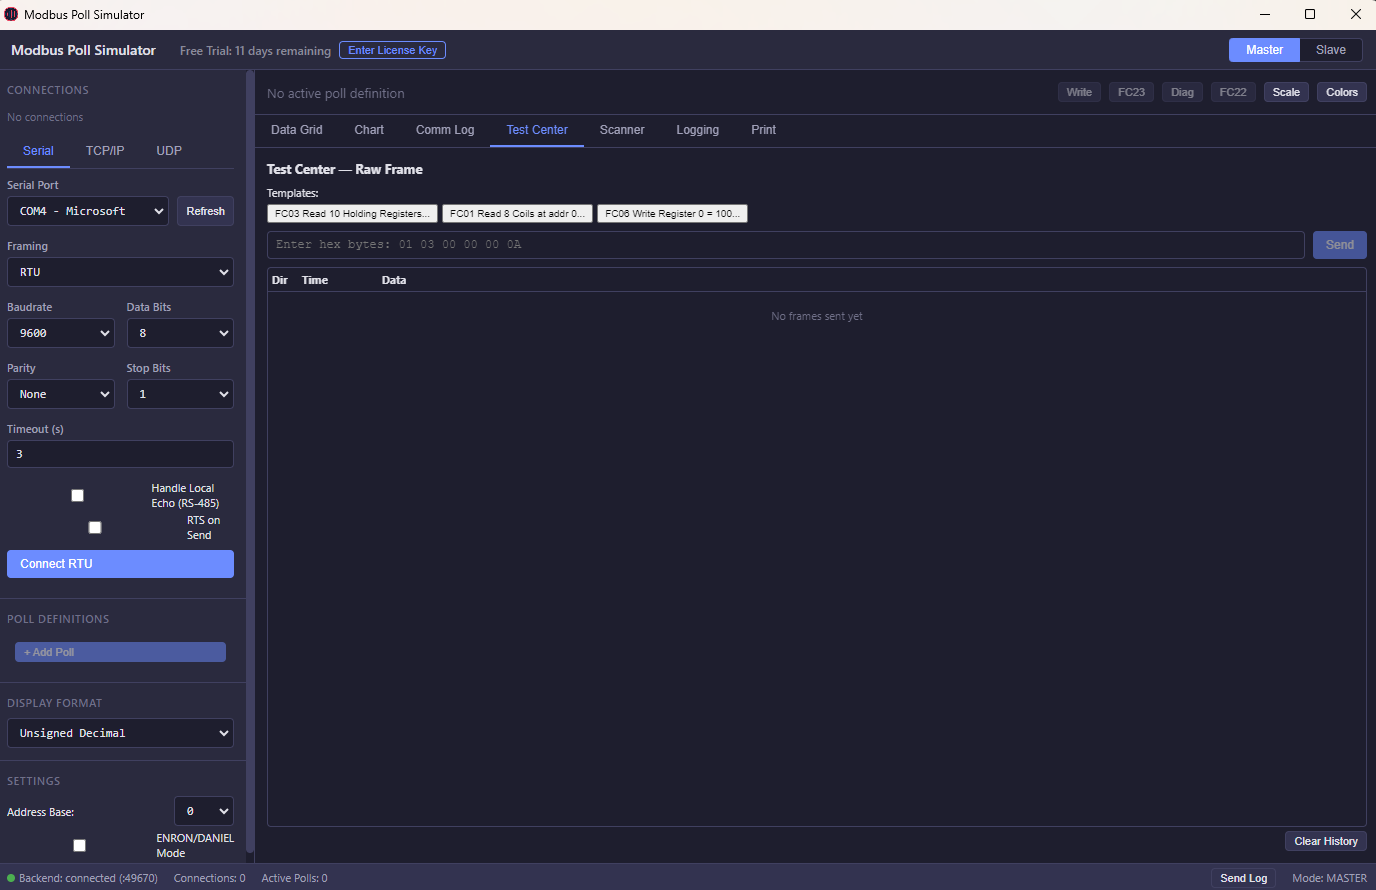 Connection Setup
Test, debug, and simulate Modbus devices without physical hardware. Live data monitoring, fault simulation, and real-time register testing. Master + Slave modes included — no subscriptions, no separate purchases.
Windows 10/11 & Linux · 64-bit · Free 30-day trial · No credit card · Download page →
A modern, intuitive interface for professional Modbus testing and simulation.
Address Scanner
Live Charts
Connection Setup
The homepage now frames the tool around concrete engineering use cases instead of only technical features.
Use it to validate device communications, inspect frames, and debug register behavior without waiting for field hardware.
Simulate slave devices or poll real equipment during factory acceptance, QA, and internal support workflows.
Diagnose connection issues faster, compare expected vs actual values, and isolate protocol problems on site.
Conversion improves when the buyer can see the business case immediately.
You do not need to buy separate tools just to simulate one side and test the other.
The site now highlights the total cost story earlier because budget-conscious engineering buyers compare long-term tool spend.
Diagnostic tooling, frame visibility, and scanning reduce the time spent guessing where communication is failing.
A paid engineering tool needs visible trust near the top, not only a feature list.
Built by an industrial automation engineer with 20+ years in PLC, SCADA, and protocol implementation.
Download the 30-day trial, validate the workflow on your own setup, then buy only if it fits your environment.
Secure payment, license delivery by email, and a 30-day money-back guarantee reduce buyer risk.
Modbus Simulator has a desktop app and a cloud app. SCADA has a desktop app and a cloud app. The site structure now matches those 2 product families clearly.
Choose desktop for protocol testing on Windows, or cloud for remote telemetry and team dashboards.
Professional Modbus RTU, TCP, ASCII & UDP simulator for Windows. Master + Slave in one app. Test PLCs and SCADA without physical hardware.
Cloud monitoring for Modbus devices with real-time telemetry, alert rules, and dashboard access for teams running distributed equipment.
Choose desktop for local HMI and historian workflows, or cloud for browser-based dashboards and remote monitoring.
Web-based SCADA monitoring. Connect Modbus, MQTT & OPC UA devices to live dashboards from any browser. No software to install.
Full-featured SCADA system as a desktop app. HMI designer, Modbus polling, alarms, historian — no internet or server required.
Professional-grade diagnostic tools now included — capabilities that competitors charge extra for or don't offer at all
See the actual protocol bytes in your communication log. Every TX/RX frame displayed in hex format for deep protocol inspection.
Inject Modbus errors in Slave mode to test your Master's error handling. Choose from 11 exception codes with 4 flexible trigger modes.
Optimize data collection beyond simple fixed intervals. Burst mode for rapid sampling, Adaptive mode auto-adjusts to network conditions.
Click any frame for deep analysis. Automatic parsing, CRC validation for RTU, field-by-field breakdown, error detection.
Competitors either don't have them or charge $50-100+ extra for similar diagnostic tools
Direct pricing. No marketing overhead. No subscriptions. Just great software.
One tool. Both sides of the protocol. Full visibility. Master + Slave included — competitors charge separately.
TCP, UDP, RTU, ASCII, RTU-over-TCP, ASCII-over-TCP, RTU-over-UDP, ASCII-over-UDP. RS-485 RTS toggle and local echo support.
FC01-06, FC08 Diagnostics, FC11 Event Counter, FC15/16 multi-write, FC17 Report Server ID, FC22 Mask Write, FC23 Read/Write, FC43 Device Info.
Real-time line charts with up to 8 simultaneous address traces. Color-coded, auto-scrolling, time-based display.
16-bit signed/unsigned/hex/binary/BCD, 32-bit float (4 byte orders), 64-bit double, 32/64-bit long, and ASCII string.
Log to CSV or XLSX in real-time. Print or export to PDF. REST API for Excel/VBA integration. Full communication logger with TX/RX hex data.
NEW: Raw frame analysis, exception injection, burst/adaptive polling, frame-level diagnostics. PLUS: Test Center, Address Scanner, color rules, scaling/offset, broadcast mode, ENRON/DANIEL addressing.
21+ display formats with 4 byte-order options. Scaling, offset, and conditional color rules.
Four core products. Two desktop apps. Two cloud platforms. Pricing is split clearly by product so buyers do not have to guess what belongs to what.
Modbus Simulator for desktop testing and protocol diagnostics. Master + Slave in one Windows app.
Cloud Modbus monitoring for teams that need telemetry, alarms, and multi-device dashboards without desktop deployment.
Affordable perpetual SCADA for Windows. Local HMI, historian, alarms, and Modbus TCP/RTU without enterprise licensing overhead.
Browser-based SCADA for remote dashboards, team access, and multi-site visibility without server setup or per-seat complexity.
Detailed Modbus Desktop pricing below is only for the Windows Modbus Simulator product. The 3 other products have their own plan structures and app-specific onboarding.
Download includes a 30-day free trial. No credit card required.
Windows 10/11 · 64-bit · 118 MB
Windows SmartScreen Warning?
After downloading, Windows may show a "Windows protected your PC" warning. This is normal for new software. To install:
1. Click "More info"
2. Click "Run anyway"
The app is 100% safe — no malware, no adware.